In this blog post, its back to statistics. July 2015 shaped up to be a great month, for buyers and sellers alike. Mickie and I were very busy closing 7 transactions which totaled over $2.2m in real estate.
Below are charts for July 2015 in:
- Months of Housing Inventory
- Average Days on Market
- Under Contract & Sold Properties
- Average & Median Home Prices
- 90 Day Perspective Report
Months of Housing Inventory
Housing inventory still remains low with July settling at 1.8 months. Being that inventory levels are still low, sellers are seeing the benefit of that limited supply.

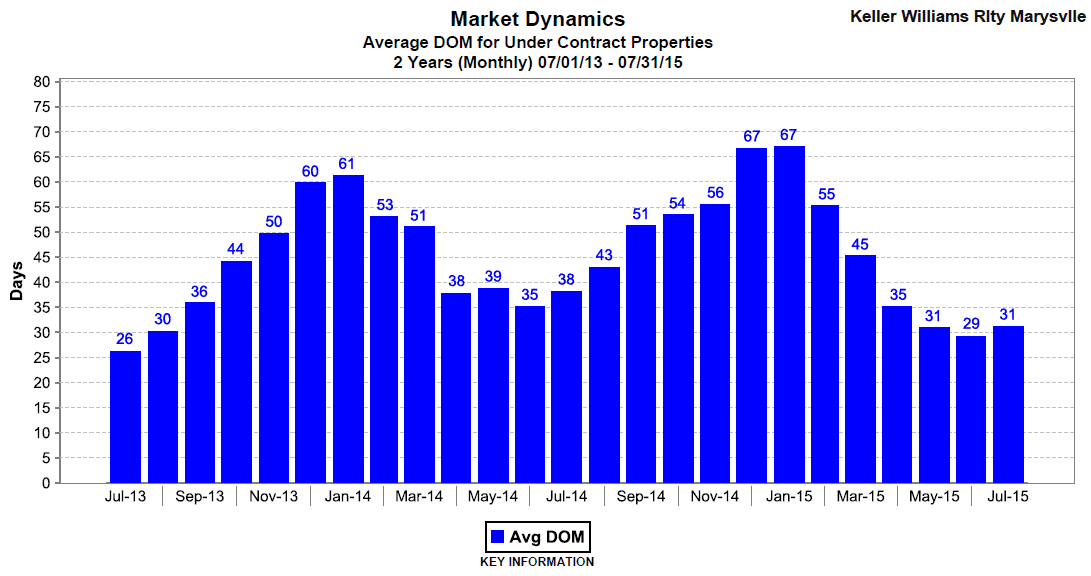
Average Days on Market
Average days are market showed a slight uptick in July and would expect to see August and September to follow suit.
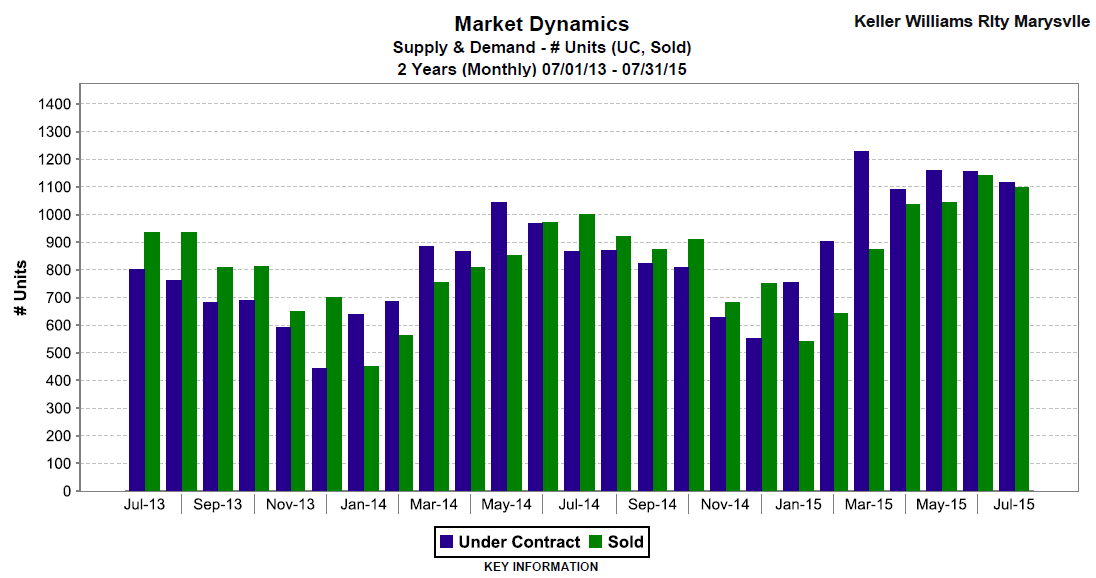
Under Contract and Sold Properties
Sold and Under Contract units slipped slightly in June and July. July is typically the busiest month for closed home sales yet with prices increasing it may have curbed growth.
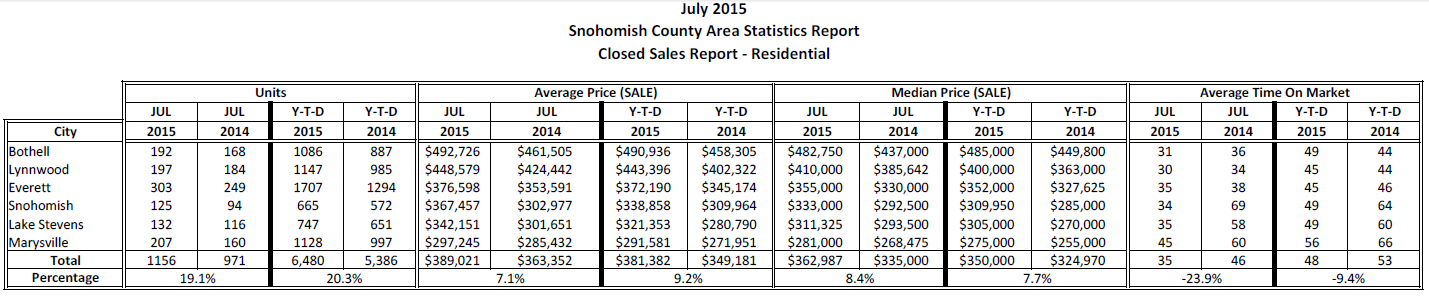
Snohomish County Average & Median Home Prices
- Units July 2015: 1156, up 19.1% from 2014.
- Average Price July 2015: $389,021, up 7.1% from 2014.
- Median Price July 2015: $362,987, up 8.4% from 2014.
- Average Days on Market: 35, down 23.9% from 2014.
90 Day Perspective Residential Report
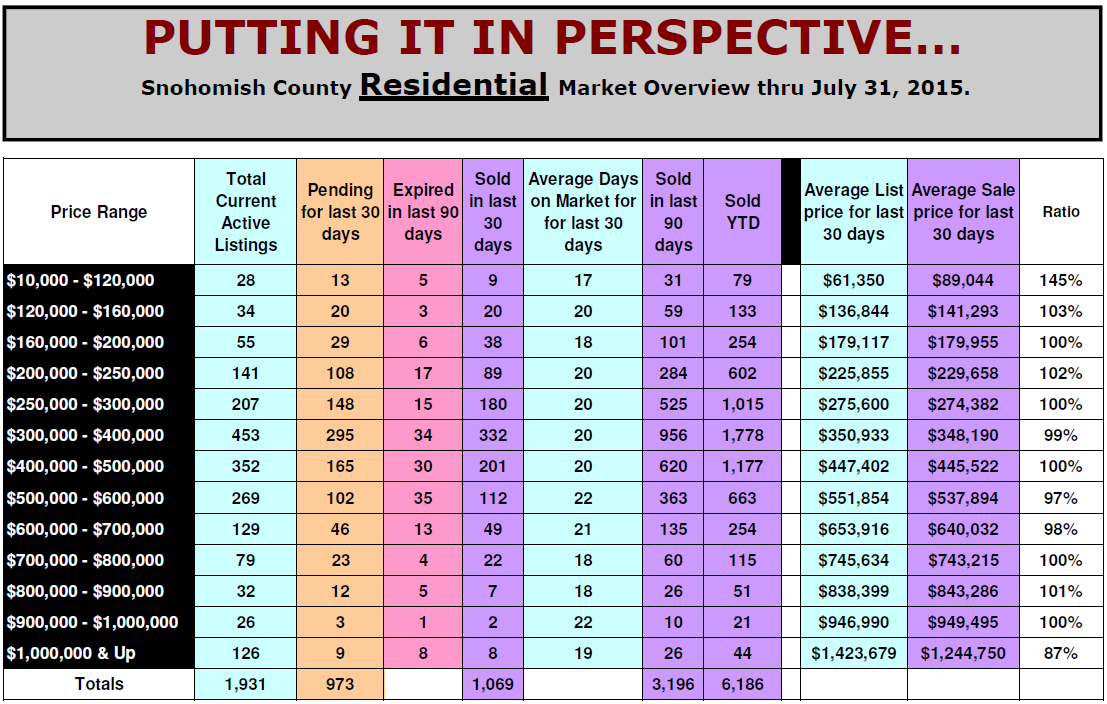
July's statistics are bit a late coming out and a bit thin on the take yet I just recieved Augusts and we'll see if there been much change through 2015's Summer.
.png)
:format(webp):quality(80)/u.realgeeks.media/barnettassociates/Real_Estate_Stats(1).png)
.png)
:format(webp):quality(80)/u.realgeeks.media/barnettassociates/sidebars/Title_and_Escrow.png)
:format(webp):quality(80)/u.realgeeks.media/barnettassociates/sidebars/subscribe-to-the-teams-monthly-newsletter.png)
:format(webp):quality(80)/u.realgeeks.media/barnettassociates/Facebook_Logo.png)
:format(webp):quality(80)/u.realgeeks.media/barnettassociates/Twitter_Logo.png)
:format(webp):quality(80)/u.realgeeks.media/barnettassociates/Instagram_Logo.png)
:format(webp):quality(80)/u.realgeeks.media/barnettassociates/Pinterest_Logo.png)
:format(webp):quality(80)/u.realgeeks.media/barnettassociates/Youtube_Logo.png)
:format(webp):quality(80)/u.realgeeks.media/barnettassociates/Linkedin_Logo.png)
