Snohomish County's residential real estate statistics for January 2014 are published below with focuses on average and median home prices, market times, inventory levels, and pricing segments. Will Snohomish County continue to a healthy recovery or will affordability continue to be pushed out of the area?
Average & Median Home Prices for Snohomish County
The average closed price home for Jan. 2014 compared to Jan. 2013 increased of 11.1% and the Y-T-D prices show the same. The median closed price increased 12.4%. In November the price increases were higher which could point to early signs of a slowing; however, the reduction in gains are not significant enough to make a conclusion.
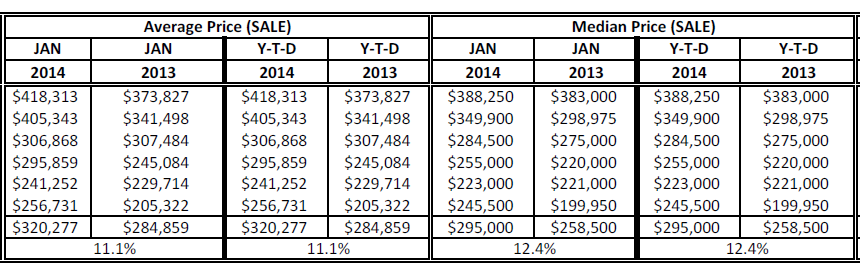
The Big 6 Areas comprising the data are: Bothell, Lynnwood, Everett, Snohomish, Lake Stevens, and Marysville.
Days on Market for Snohomish County Homes
In November the days listed equated too 51 days, then increases to 59 during December, and settling at 67 days in January. Right now, it's common practice for REO inventory to be listed higher than market value and reduce as the property gains market time. Unlike the early parts of the 2007 recession, homes were listed below market value to get them sold. Even normal resellers are experience longer market time while buyer's pick and choose homes instead of getting caught up in a purchase rush.

Increasing Snohomish County Housing Inventory
While November's statistics show real estate inventory declining, January's report shows a different story.
- Why is that?
- Why is data in November's post so much different?
The reports change due to homes returning to an Active status (sale failed), and/or homes not closing when a previous report was generated, and homes being relisted after the report was generated and subsequently changing the data.
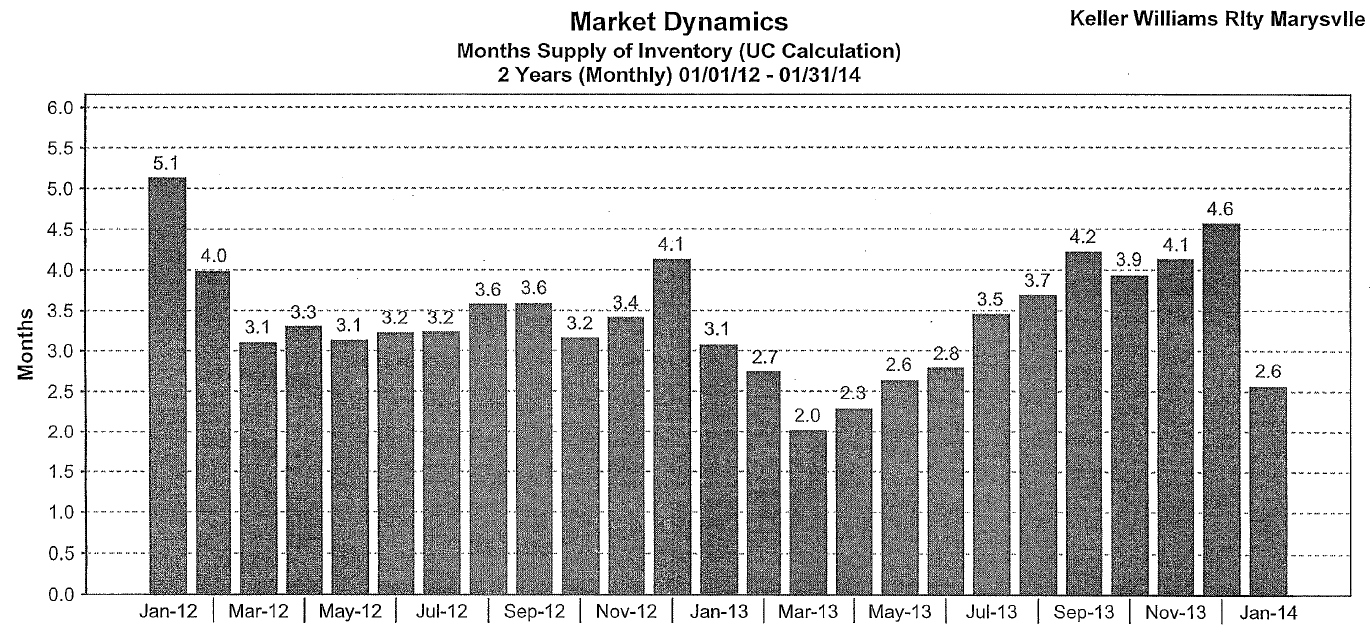
In January's inventory report there are signs the real estate market shifting towards the buyer's favor, progressively increasing from March's low to December's high of 4.6 months then plummeting down to January's 2.6. This could be an isolated incident.
One hypothesis is: many listing agents, including myself, use the end of the year for a listing's contract expiration date. So if an agent is not paying attention to get an extension signed then the listing auto expires on the NWMLS, resulting in for sale inventory dropping sharply.
Snohomish County's Busiest Pricing Segments
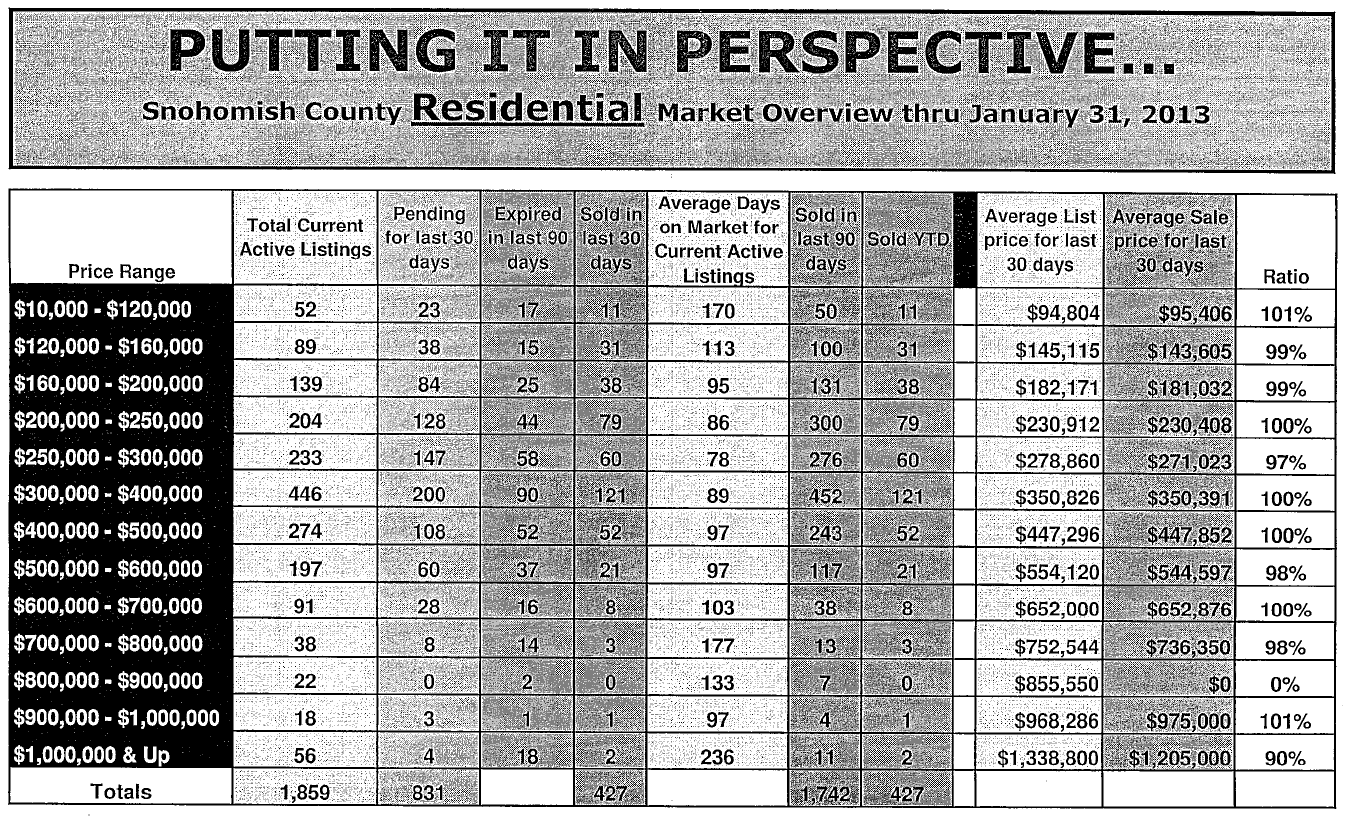
The most active real estate pricing segments are homes priced from $200,000 to $500,000 with the majority of the sales being in $300,000 - $400,000 rage - 121 sold units. These segments also have the least continuous days on market.
Conclusion: Snohomish County Real Estate Statistics for January 2013
Many around the office are speculating housing prices will continue to increase, anywhere from 6-14%. However, the data is point to more so of a flat real estate market with market times increasing, inventory rising, and homes selling for list or just under list price.
.png)
:format(webp):quality(80)/u.realgeeks.media/barnettassociates/Real_Estate_Stats(1).png)
.png)
:format(webp):quality(80)/u.realgeeks.media/barnettassociates/sidebars/Title_and_Escrow.png)
:format(webp):quality(80)/u.realgeeks.media/barnettassociates/sidebars/subscribe-to-the-teams-monthly-newsletter.png)
:format(webp):quality(80)/u.realgeeks.media/barnettassociates/Facebook_Logo.png)
:format(webp):quality(80)/u.realgeeks.media/barnettassociates/Twitter_Logo.png)
:format(webp):quality(80)/u.realgeeks.media/barnettassociates/Instagram_Logo.png)
:format(webp):quality(80)/u.realgeeks.media/barnettassociates/Pinterest_Logo.png)
:format(webp):quality(80)/u.realgeeks.media/barnettassociates/Youtube_Logo.png)
:format(webp):quality(80)/u.realgeeks.media/barnettassociates/Linkedin_Logo.png)
